Point Cloud Visualization

The module consists of classes and functions to plot cloud of point data, voxels and KMCs

_images/combined.png

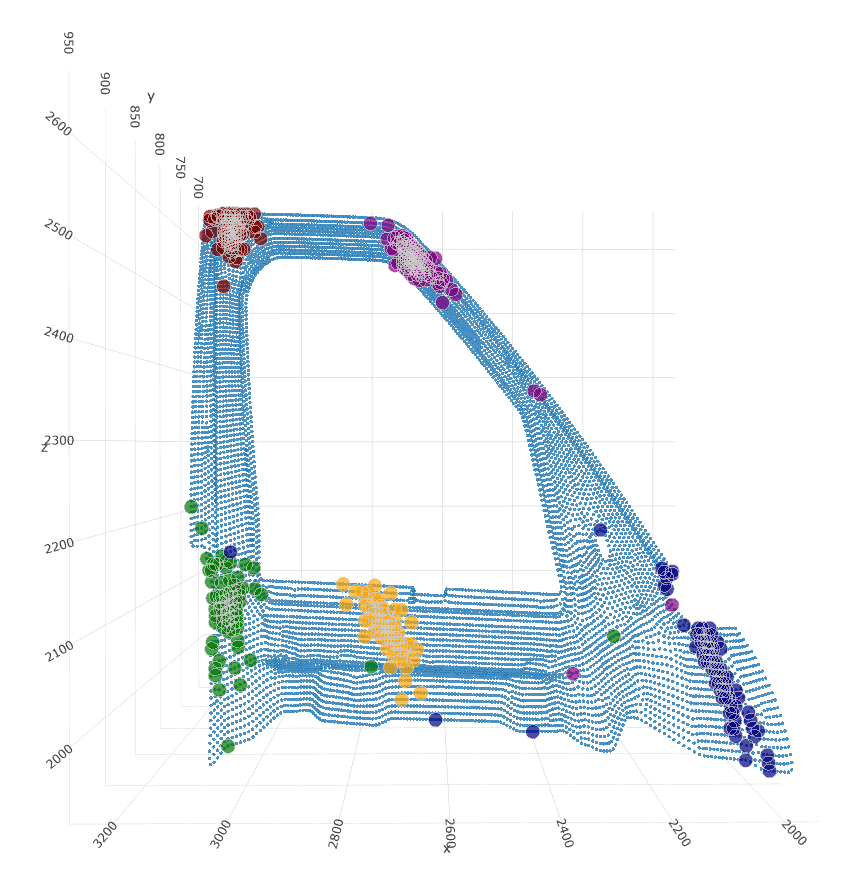
Fig 1: Cloud of Point with KMCs

Contains classes and methods for visualizing the cloud of point data, the KMCs and the voxelized cloud of point data

class dlmfg.visualization.cop_viz.CopViz(nominal_cop)[source]

Cop Visualization class methods and objects to visualize different forms of COP data

Parameters

nominal_cop – nominal_cop [nodes*3]

get_data_stacks(node_id_x, node_id_y, node_id_z)[source]

used to obtain co-ordinates for selected node IDs for each axis

Parameters
  • node_id_x (list (required)) – List of KMC node_ids considering x deviations

  • node_id_y (list (required)) – List of KMC node_ids considering y deviations

  • node_id_z (list (required)) – List of KMC node_ids considering z deviations

Returns

list of KMCs for three axis

Return type

list

plot_cop(plot_file_name)[source]

used to plot the COP data using plotly library

Parameters

plot_file_name – filename with which the plot is saved

plot_multiple_stacks(stack, plot_path)[source]

used to plot all the KMCs as overlay on cloud of point data

Parameters
  • stack (list (required)) – List of list of KMCs for three axis

  • plot_path (str (required)) – plot path to save all the KMCs

plot_voxelized_data(voxel_data, component)[source]

used to plot the voxelized cloud-of-point data

Parameters
  • voxel_data (numpy.array (required)) – voxelized COP data

  • component (int (required)) – The component of deviation to be considered while plotting

  • plot_file_name – File name to save plot file